


 Your new post is loading...

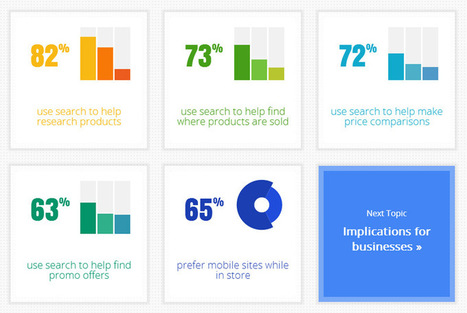

Google's Databoard lets you explore insights from Google research studies, share them with others, and create your own custom infographics.You need to give a presentation at your office or for a client. You need statistics to back up your data. What do you do? Go data mining? Go fishing for data? That can really be time consuming. This is on top of the time you need to prepare and create the presentation proper.What if there was an interactive tool that can easily search out industry-leading research, help create stories using the stats, and even create infographics using selected charts and graphs?Google has one now!...
Via Jeff Domansky


The best source in town for available research subjects. Thanks for sharing this heavy tool.
Via Jeff Domansky, always a font of good info. A quick way to add credibility to a claim.