New heat records were set across Southern California as temperatures soared in advance of Tuesday’s World Series opener at Dodger Stadium.
Get Started for FREE
Sign up with Facebook Sign up with X
I don't have a Facebook or a X account


 Your new post is loading...
 Your new post is loading...
Your new post is loading...
New heat records were set across Southern California as temperatures soared in advance of Tuesday’s World Series opener at Dodger Stadium. 
No comment yet.
Sign up to comment
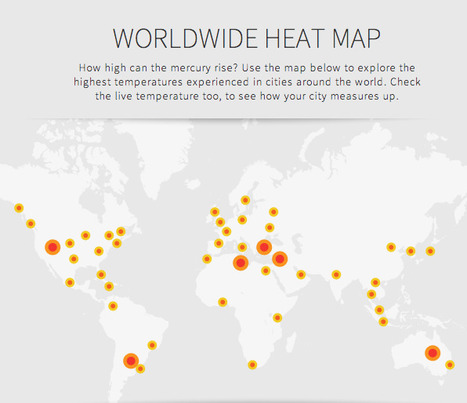
The Andrew Sykes Group, a large air conditioning firm based in the UK, has developed this interactive displaying record highs, and current temperatures from select cities across the globe. While Climate Central's interactive tool (displaying the average temperature cities across the U.S. are expected to reach by 2100) did little to make those of us suffering a sweltering summer feel optimistic about the future, the interactive graphic at the link provides some perspective that current temperatures could be worse. The Andrew Sykes Group has developed this interactive displaying record highs, and current temperatures from select cities across the globe. Smaller nodes represent cities, while larger nodes stand for the hottest temperatures ever seen on each continent. Via Lauren Moss

Stephane Bilodeau's curator insight,
August 9, 2014 8:08 PM
The Andrew Sykes Group has developed this interactive displaying record highs, and current temperatures from select cities across the globe. Smaller nodes represent cities, while larger nodes stand for the hottest temperatures ever seen on each continent.
Produced by the International Geosphere-Biosphere Programme and Globaia and funded by the UN Foundation for the launch of the Intergovernmental Panel on Climate Change (IPCC) Fifth Assessment Report. The data visualization summarises several of the most significant statements in the IPCC’s latest summary for policymakers published September 2013. This summary covers the physical science basis of climate change. In 2014, IPCC will publish summaries concerning societal impacts, mitigation and adaptation. Via Szabolcs Kósa
|
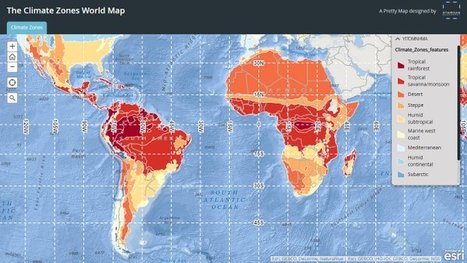
"Obsessed as we are with cartography we in Staridas Geography perceive any aspect of the actual 3D World as a constant opportunity for another pretty map creation!"

GTANSW & ACT's curator insight,
August 19, 2016 7:47 PM
Great map to discuss global distribution of biomes and links to climate 
Sally Egan's curator insight,
August 21, 2016 6:24 PM
Fun way for students to learn about the diverse climates around the world, by selecting a location on the map students are shown the climatic data of the selected place.
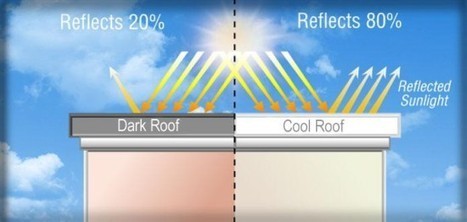
What’s the coolest place in Los Angeles? It may be right over your head. Starting in 2014, thanks to an update of the Municipal Building Code, all new or refurbished buildings will be equipped with “cool roofs.” A cool roof is built of reflective rather than absorptive material. Compared to traditional roofs, cool roofs can be as much as 50 degrees cooler on the roof surface, and can lower interior building temperatures by several degrees. Los Angeles is the first major American city to pass a cool-roof ordinance... Via Lauren Moss
PIRatE Lab's insight:
We can even go this one better with green roof designs. But light is preferable to dark when it comes to surfaces in our hot climate (this is why adobes were white washed). Our most energy-intensive season is the the hottest period at end of summer/early fall months, with most of that energy going into air conditioning to cool heated buildings.

Norm Miller's curator insight,
January 8, 2014 1:48 PM
Great to see LA becoming a leader in requiring cool roofs that cost no more. |