Rent, transport, and phone are too expensive for 43% of Americans.
Get Started for FREE
Sign up with Facebook Sign up with X
I don't have a Facebook or a X account


 Your new post is loading...
 Your new post is loading...
Your new post is loading...
Rent, transport, and phone are too expensive for 43% of Americans.
PIRatE Lab's insight:
Wow! 49% of California can't afford minimum of middle-class security.

No comment yet.
Sign up to comment

ISRIC has released a large set of standardised soil profile data for the world. It contains 4 million records for some 94 thousand profiles. The data are freely available from our website. The data come from various sources. The provenance and licence strongly determined which data could be standardised and subsequently served to the international community.
PIRatE Lab's insight:
Great data set here for terrestrial productivity, etc. studies.
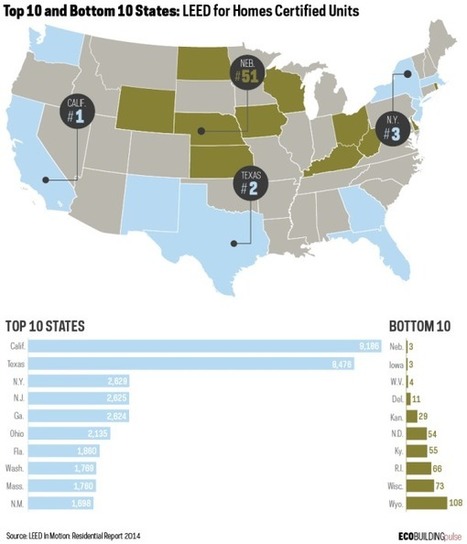
There are 150,000 LEED-certified housing units across the world, according to a new report. Is your state in the top 10 or the bottom 10 for the U.S.? There are now more than 150,000 LEED-certified housing units worldwide, according to the U.S. Green Building Council's LEED in Motion: Residential report. Where does your home state stack up? Visit the link for the top 10 and bottom 10 states per certified units. Via Lauren Moss
PIRatE Lab's insight:
Another example of the growing coastal-inland divergence in almost all aspects of our society.

Researchers at the University of Adelaide have been exploring how using public weather forecast information can help deliver significant reductions in energy consumption.
Combining information from the Bureau of Meteorology with data from existing building management systems, the researchers have developed an intelligent model that remains one step ahead of the building’s temperature changes, automatically adjusting the heating and cooling supply accordingly. Early experimental results have provided encouraging results, with at least 10 per cent energy savings shown to be possible. Via Lauren Moss
|

The advent of big data was supposed to usher in a more precise and rational world. Instead, it might be leading us into the swamp of "alternative facts." Via pdeppisch

malek's comment,
February 17, 2017 3:17 PM
I wish I knew "anonymous browsing 10 yrs ago, for now, I'm using Duckduckgo
malek's comment,
February 17, 2017 3:22 PM
Hobbes and modern political philosophy should be a part of modern education, I'm not sure about Trump
malek's comment,
February 19, 2017 4:28 PM
Speaking of the devil "We Used Terrible Science to Justify Smoking Bans" http://www.slate.com/articles/health_and_science/medical_examiner/2017/02/secondhand_smoke_isn_t_as_bad_as_we_thought.html
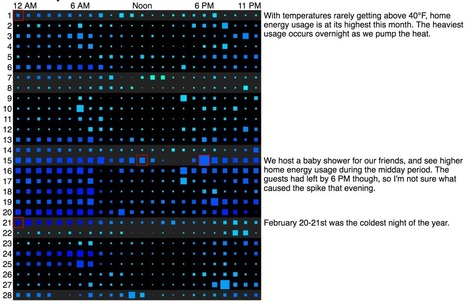
Michael VanDaniker found that his energy provider, Baltimore Gas and Electric, provides customers with an easy-to-use tool to export their home’s energy usage by the hour. So he downloaded the CSV and had a look back at 2015, through the eyes of heating and cooling. Fun. By the way, is this data availability a normal thing these days? I was surprised that BGE provided an export tool, but then I checked my energy provider PG&E, and they have one too.
PIRatE Lab's insight:
The more tools we have to analyze our behavior and consumption patterns, the more informed we can all be about our behavior and (ultimately) impacts.
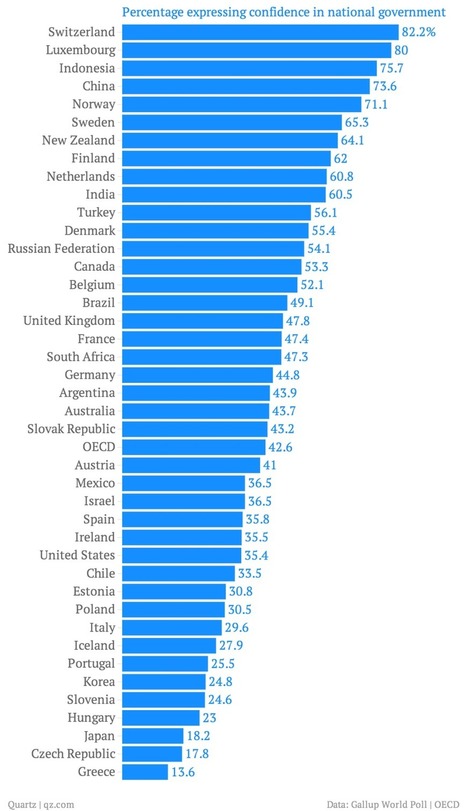
The Paris-based think tank known as the OECD is just out with its semi-annual survey of how different economies stack up in terms of social well-being. (Well-being is basically the polite way economists talk about happiness.) The organization even has a new data visualization to let you see where your country ranks in certain key measures. Called "Society at a Glance," the report is well worth a read. But here are some of the most interesting bits of data we found, in no particular order. Via Lauren Moss
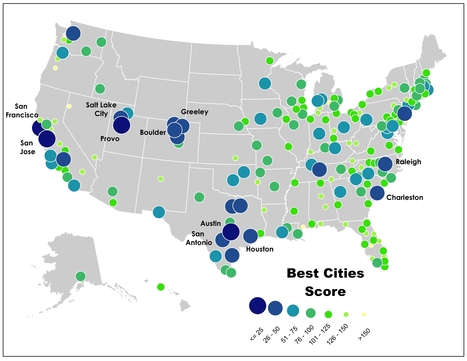
New rankings from the Milken Institute show just how diverse our tech economy has become. To the casual observer, the narratives of economic growth in American cities seem fairly obvious: the Sunbelt is adding people, the Rustbelt is failing, and big cities like New York, Chicago, Boston and D.C. are coming back. But the reality is far more complicated once you start adding real-world statistics into the picture. Each year, the Milken Institute’s "Best Performing Cities" index injects some much-needed clarity into the debates surrounding metro growth and decline. An "outcomes-based" ranking, the report takes into account both short and long-term growth in job numbers, wages and salary, and the concentration and size of high-tech industries — an increasingly important part of success in today’s knowledge-driven economy. The result is a data-driven look at economic growth in America's 200 largest metropolitan areas. Via Lauren Moss
|